
Ratiometric flow cytometry plot
Posted: 2017-04-21 Filed under: academic | Tags: FACS, fcsalyzer, flow cytometry, fluo, fura red, ratiometric Leave a commentI decided to make a ratiometric flow cytoetry analysis in FCSalyzer, since the program is free, cross-platform and easy to use (also, I just like it a lot). Such feature, however, has not been implemented yet, but is in the to-do list of the developer, Dr. Sven Mostböck. As a workaround, I used two small programs from the same author: FCS2Data and Data2FCS.
- FCS2Data can convert a flow cytometry acquisition file (say, a FCS) into a plain text file, which can be opened in a spreadsheet program. There, the ratio between any parameters can be easily calculated.
- Data2FCS can convert the text file back to a FCS file, which can be opened by a flow cytometry offline analysis program such as FCSalyzer.
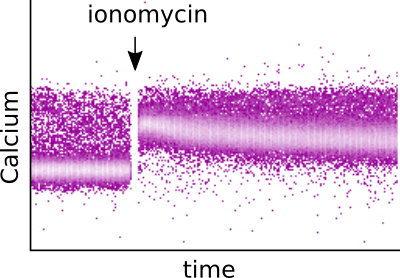
I am measuring the dynamics of intracellular calcium (Ca++) mobilisation in lymphocytes by flow cytometry. Cells are loaded with Fluo 4 and Fura Red fluorescent calcium indicators (ThermoFisher), both excitable by a blue laser (488 nm). An increase in the intracellular calcium levels leads to an increase of Fluo 4 fluorescence (emission at ~525 nm). Conversely, Fura Red exhibits a decrease in its fluorescence intensity upon Ca++ binding, emitting at ~660 nm. The two dyes are widely used in tandem, as calcium indicators that allow a ratiometric analysis of Ca++ flux.
In the example below DT40 cells (a chicken cell line) were stimulated with ionomycin. Data was acquired by FACSCalibur. Analysing the two dyes separately is quite straightforward:

Based on their FSC (size) and SSC (granularity), the population of living cells was gated in R0. Next, the mean fluorescence intensity of Fluo 4 (FL1, green) and Fura Red (Fl3, orange) was plotted over time.
Then, I opened the flow cytometry acquisition file with FCS2Data and, as the program asked, defined the name of the output text file by specifying a suffix. I imported the data from the text file into WPS Spreadsheets and created a new column alongside the colums for FSC, SSC, FL channels and Time. I called the column ‘Ratio’, as it simply calculates the values of FL1 / FL3:

I saved the data as a plain text file, which can be used by the second program, Data2FCS. Now it’s time to convert the text values back to FCS format, which will have the extra parameter ‘Ratio’. It seems OK to just accept the default settings, although the Log display boxes can be checked for FL1, FL3 and Ratio (in this way they will be recognised directly as Log values by FCSalyzer):

This is it! The new file can be opened by FCSalyzer, and the ‘Ratio’ parameter can be plotted even against FL1 or FL3! This can be very useful if you want to ‘clean’ your data by further gating.
With the help of Inkscape for a final touch, there’s a cool figure:
I am going to submit a SlackBuild for FCS2Data / Data2FCS pretty soon. I have it ready, but there are a few things to polish.
EDIT (01 May 2017): Data2FCS has been added to SBo.
